Finding correlations between objects detected in Street View images and socio-economic outcomes in an urban environment.
Wandering through the streets of London, we often have quite a good intuition for whether a certain part of the city is well-off or not. Whether it’s the number of fancy cars, people in suits, or the density of Waitrose supermarkets, we find that we have a pretty good hunch as to whether a neighbourhood is at the top, bottom, or somewhere in the middle of the socioeconomic totem pole of that particular area.
Inequality measures of neighborhood socioeconomic status are largely presented as statistics gathered by state authorities. Yet, collecting census data at a high spatial and temporal level is not only time-consuming, but also expensive. Researchers have come up with alternative ways to measure urban inequality. Among these researchers is Esra Suel from the ‘Pathways to Equitable Healthy Cities’ project. Her paper shows that inequality outcomes can be predicted from Street View images of a city using an end-to-end trained neural network.
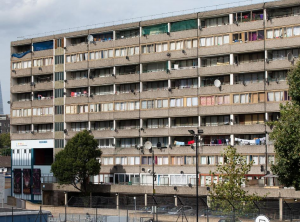
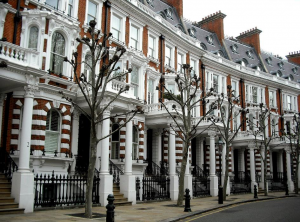
Fig. 1 Quite a different setting: Housing in Southwark (left) and Chelsea (right) in London
So what exactly is it in the picture that gives us the most information about the wellbeing of an area’s residents? Can specific objects – such as cars or plants – in an image tell us something about health inequalities?
In my Master’s thesis, I explored these questions seeking to determine whether we can use heuristics – such as objects detected in imagery – to predict inequality outcomes. By identifying hypothetical predictor variables one can make the outputs of a neural network a little bit more interpretable.
For this purpose, I used a pretrained neural network to identify specific pre-defined visual markers of social and health related status with an object detection algorithm in London. Using an algorithm that has been trained on a different, labelled dataset is a common machine learning practise and is called ‘transfer learning’. The algorithm is trained on objects that are included in the widely used data set called Common Objects in Context (COCO), and contain images of people, cars, plants and bicycles, etc.. After training the algorithm on the labelled dataset, it was used to analyse over half a million panoramic Google Street View images capturing the London area.
The figure (Fig. 2) below shows the most common objects that were picked up in London Street View Imagery by the object detection algorithm trained on the COCO dataset.
The car was the most commonly detected object, with over 2 million cars registered by the algorithm. The algorithm further picked up roughly 250 000 people, and tens of thousands of trucks, plants, benches, busses, traffic lights and bicycles in the dataset.
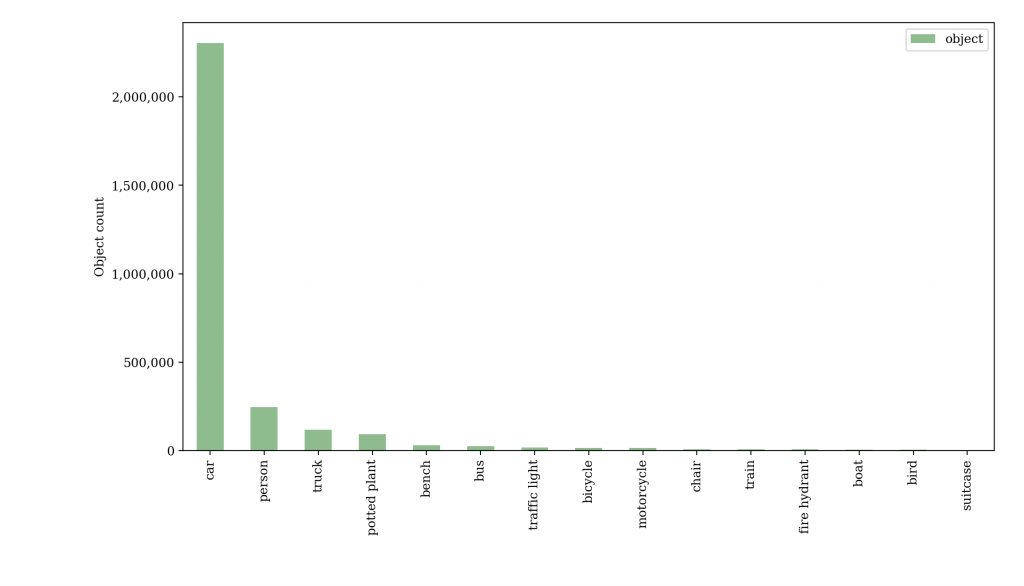
Fig. 2 Total number of top 15 objects detected in all images.
The frequency — of the objects detected per image per small administrative unit in London — alone, showed some interesting results. The numbers of cars and the number of people within the average image exhibited quite contrasting patterns. Figure 3 indicates that cars are more commonly detected outside of the inner city of London, and exactly the opposite is true for the number of people detected.
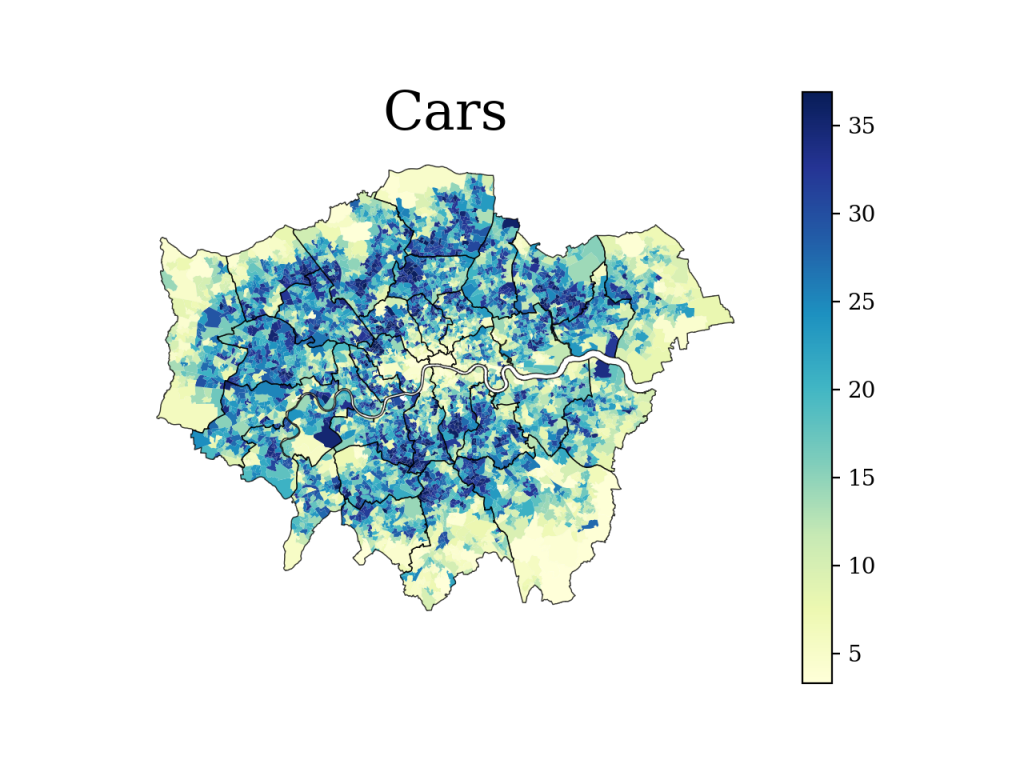
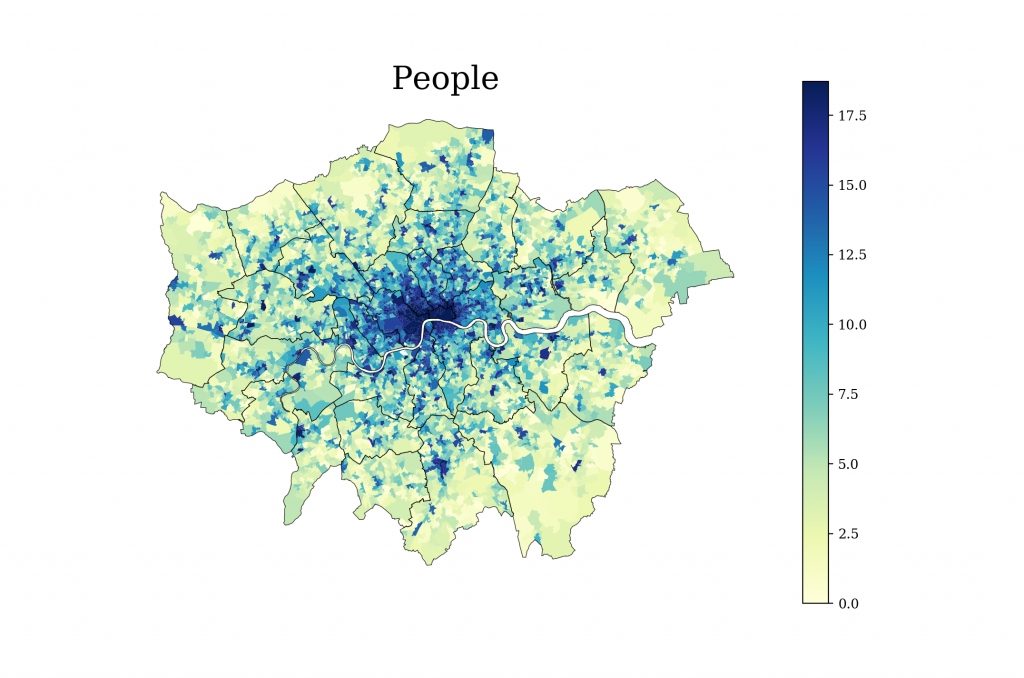
Fig. 3 Number of cars and people detected per panoramic image per small administrative unit of London (LSOA).
After retrieving the object counts, I examined the relationship between the 10 most commonly detected objects and inequality outcomes, namely average income, living environment deprivation and health deprivation with two different machine learning classifiers, a support vector classifier and a random forest classifier. By identifying correlations between the objects in the images and the measures of inequality, one can consequently discern their predictive power within the Street View imagery.
Living environment deprivation was most accurately detected, which suggests that the pre-defined objects within the images mirror the pollution (sources), quality of housing and road safety to some extent. Inspecting the variables, I found that the number of people detected indicates the strong correlation to the living environment inequality measure. The prediction performance for the mean income decile was not as high as that for the living environment prediction. This seemed surprising, since one might assume that objects, such as cars and potted plants, are an exemplar of wealth and exhibit a stronger visual correlation. Moreover, the prediction of health deprivation revealed the weakest allocation performance. This could imply that the objects detected are weaker proxies for mortality, morbidity and hospital admissions rates.
In summary, the ‘meet-in-the-middle’ approach of identifying objects in images in order to predict inequality outcomes has shown some promising results. However, it has to be noted that the allocation performance was not as high as the end-to-end solution of a neural network. This is not surprising as I have deliberately chosen only parts of the information that the images carry. The interpretability of this model thus comes at the price of a lower accuracy — a common trade-off for most statistical models.
While I was limited to predefined objects, this thesis has shown that the ‘meet-in-the-middle’ approach helps us to understand which parts of an image carry implicit information about the socioeconomic status and health of urban residents. It also taught me that off-the-shelf models are computationally efficient and can work well for transferring knowledge from one machine learning task to another. Finally, meeting in the middle is not always simply about compromise, but actually a successful strategy for making machine learning models a bit more intuitive and interpretable.