In March 2021, researchers from 6 countries in the Pathways consortium came together to share on-going work related to health and socioeconomic inequalities across the project’s five study cities. While typically held in person, we moved the meeting online rather than postpone for a second year running.
This meeting fostered a consortium-wide discussion on how we can use interdisciplinary scientific evidence to inform policy efforts toward achieving equitable and healthy cities. This annual “face-to-face” meeting is a crucial part of the Pathways mission to develop reliable and useful data to support policy-making and advocacy efforts of community leaders.
Income inequality & health
How does income inequality relate to urban health? On a macro-scale, high inequality within cities reduces growth, and creates economic and political instability. For individuals, inequality affects access to health care, education, job markets, and transportation. While some have access to an array of resources and opportunities, others have limited or no access at all.
Compounding inequalities make it difficult for marginalized groups to climb the socio-economic ladder and be happy and healthy participants in society. Ultimately, high inequality can result in worse population health and higher poverty rates. If the goal is making meaningful policy to reduce health inequalities, we need to understand where the poor live, and how their living and environmental conditions impact their health.
Socio-economic inequalities in Accra, Dhaka, and Beijing
The symposium began with a session on mapping socio-economic status in project cities Accra, Dhaka, and Beijing. Identifying where the poor live is challenging, especially in places where high-resolution data on income and other socioeconomic indicators are limited. In Accra and Dhaka, we applied statistical models to link available data to predict consumption for each neighbourhood, whereas in Beijing, this is done by connecting satellite and survey-based data to measure neighbourhood status.
Figure 1: Mapping 2010 Enumeration Areas in Accra for a) Poverty (bottom 30%), b) Inequality (Gini Coeff.), and c) Development levels (Med. Log Equivalized Consumption).
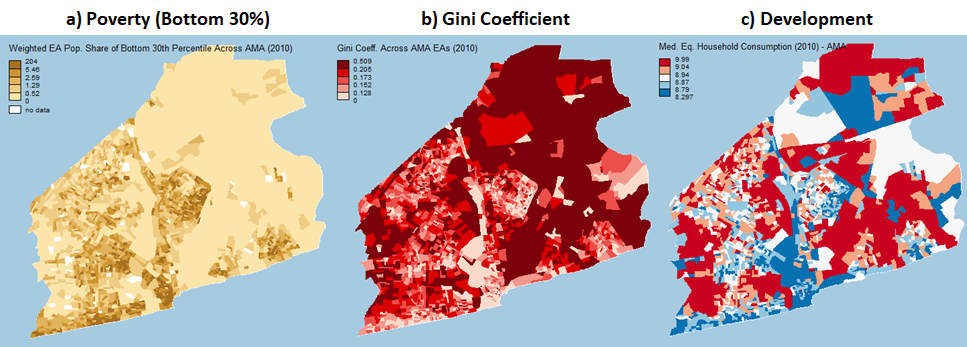
Source: Alicia Cavanaugh’s presentation on Poverty & Inequality Mapping in Ghana
Figure 2: Mapping 2011 Poverty in Dhaka Wards for the a) bottom 5% and b) bottom 10%.
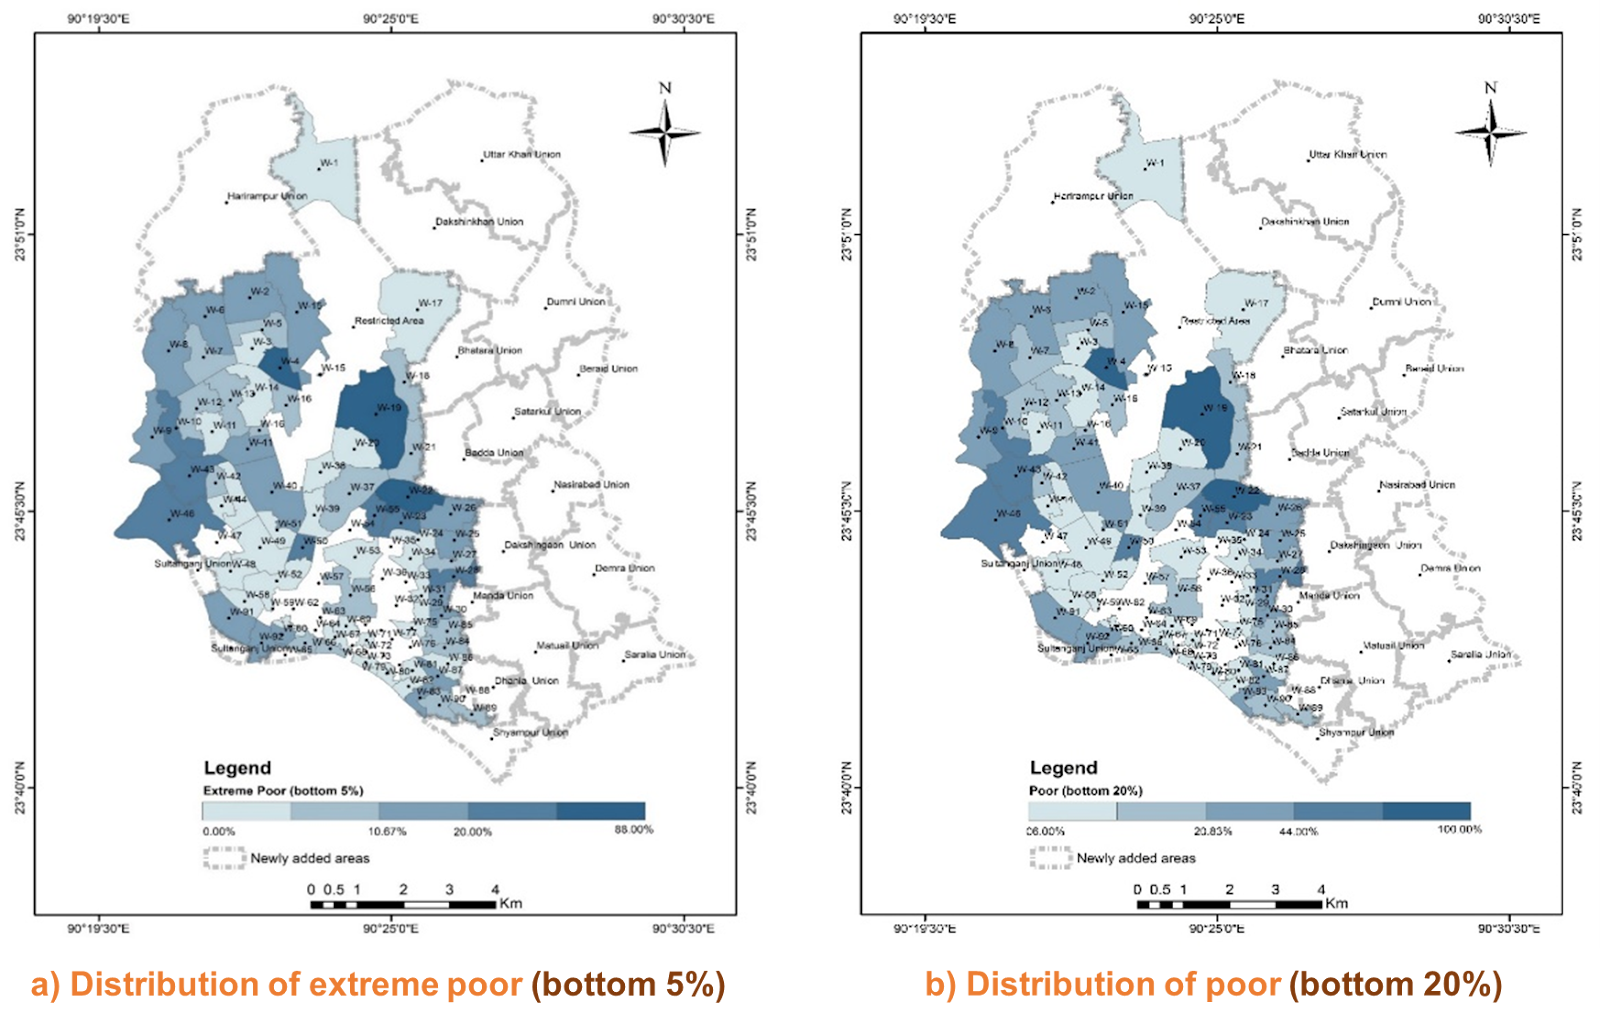
Source: Zahid Quayyam’s presentation titled Predicting and mapping poverty in small areas of Dhaka City: a mixed effect model approach using consumption data
Figure 3: SES Mapping within the 5th Ring Road in Beijing using a) the ratio of non-blue-collar workers and b) average household income.
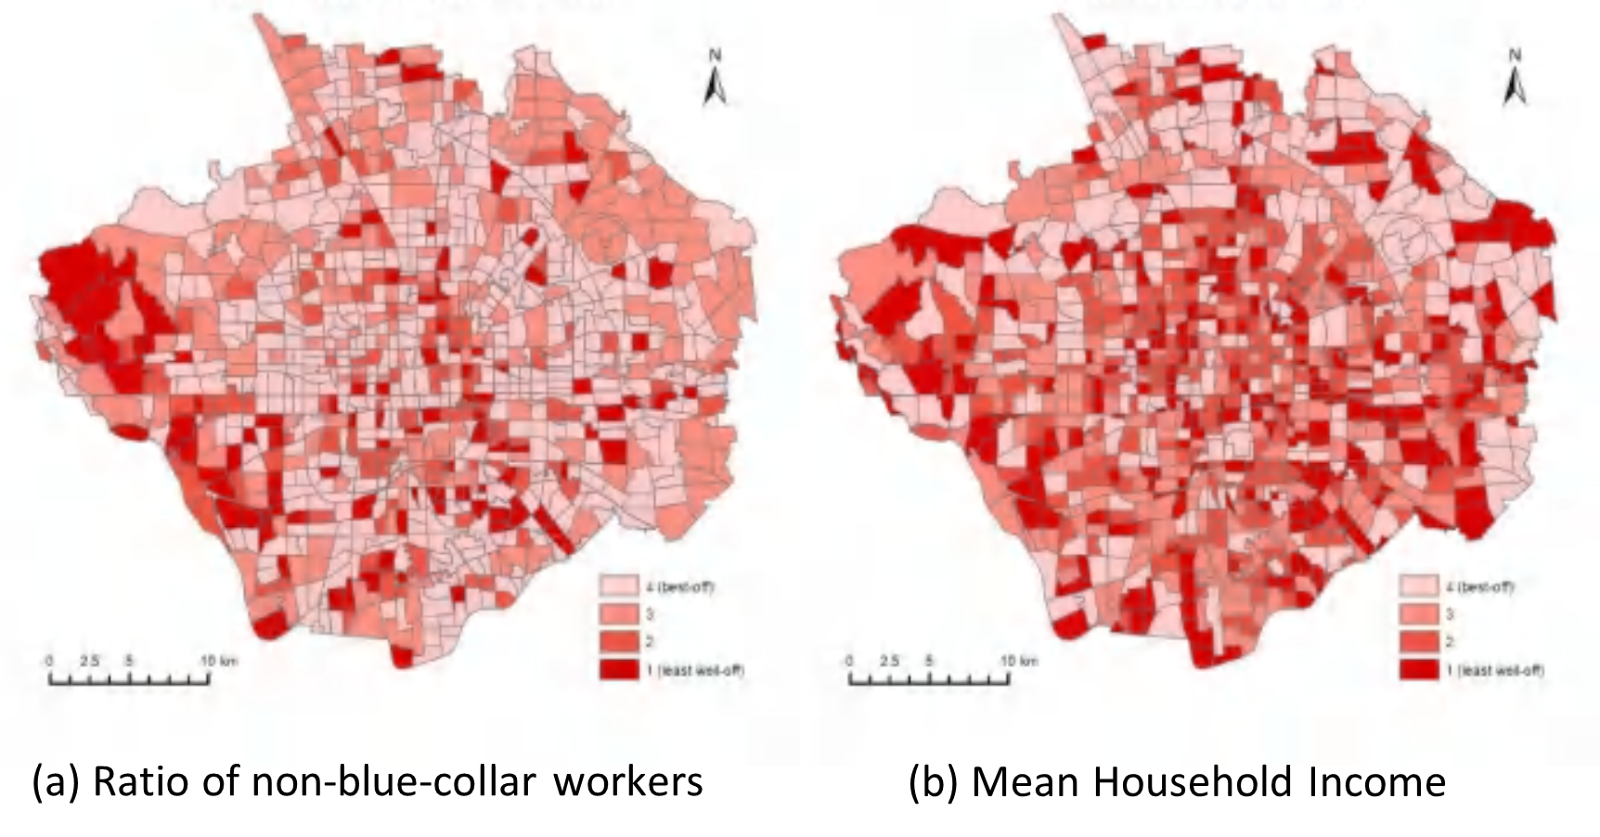
Source: Ying Long’s presentation titled Measuring Neighbourhood and Socio-Economic Status from street and sky: A case study in Beijing.
This shows us where not only the poor and wealthy are concentrated, it can also show relative status of neighbourhoods as compared to other places in the city, and how disparities are experienced by the poor and affluent alike. These socioeconomic data can also be linked to spatially-resolved data on health, environment, housing, and transportation to shed light on how poverty and inequality may influence the living conditions, environmental risks, health, and well-being of urban populations.
Health inequalities in Accra, London, Beijing and Vancouver
For the second session in the symposium, researchers presented work linking census and survey data to estimate health inequalities. In Accra, researchers developed models to map child mortality, finding significant inequalities across space (Fig. 4). Researchers in Beijing presented results of all-cause mortality (Fig. 5), as well as maps of cardio-vascular incidence over time, showing disparities across space, as well as gender and age.
Figure 4: Neighbourhood child mortality rates relative to mean across GAMA and AMA (2010).
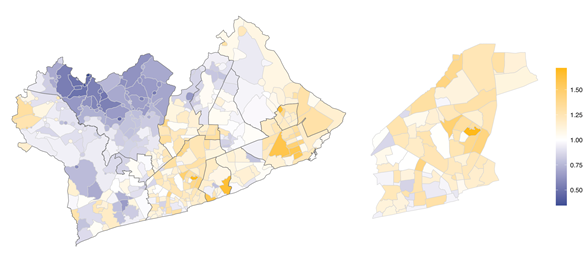
Source: Honor Bixby’s presentation on “Inequalities in child mortality across neighbourhoods in Accra, Ghana”
Figure 5: Deciles of age-standardized rate of all cause mortality (per 100,000) by township in Beijing, 2017-2018.
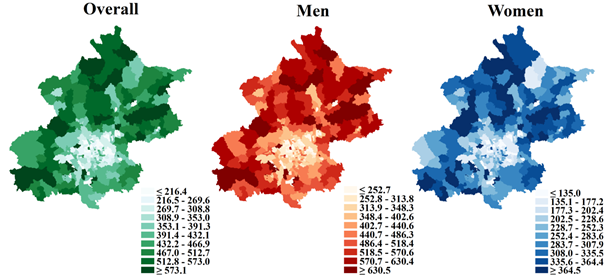
Source: Jing Liu’s presentation titled “Measuring and estimating health inequalities in Beijing”
In Vancouver, life expectancy and changes in mortality rates for 20 causes of death were modeled over a 25-year period, showing increasingly large disparities across the city (Fig. 6). In London, analysis modeled life expectancy over 30 years, showing an increase in life expectancy for the wealthy (Figure available upon request).
Figure 6: Life Expectancy in Metro Vancouver Census Tracts in 2016.
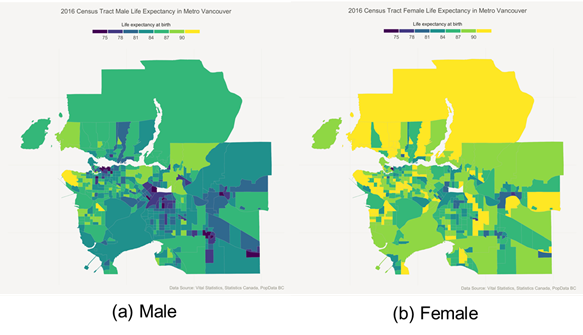
Source: Jessica Yu’s presentation titled “A spatiotemporal analysis of inequalities in life expectancy and 20 causes of mortality in sub-neighbourhoods of Metro Vancouver, British Columbia, Canada, 1990-2016”
The advantage of identifying where health outcomes are the worst, or the best, is that we can describe characteristics common to these areas (and the populations that live in these places) that may influence community health – for better or for worse. Linking health inequalities to socio-economic, demographic, housing, environmental, and transport data can draw attention to the populations most at risk, while fostering an understanding of the population or environmental factors that create diverging health outcomes.
Inequality & policy
Quantifying health inequalities can inform policy decisions by contextualizing inequality at a geographic-level that is meaningful for local decision-makers and advocacy groups.
If inequality among groups and space is not considered, implementation may be inhibited or the policy may even exacerbate inequality. For instance, local communities with a varying array of economic, social and political resources have different capacities to administer policy, which can result in unequal implementation across a city. Marginalized populations may be more vulnerable to the effects of a given disease because they are exposed to other interacting causes — policies reducing exposure may have the biggest effect in the least privileged groups.
Interventions that target individuals (e.g. vaccination, surgical intervention, counseling) may disproportionately benefit higher income and more educated groups, and inequality-agnostic policy can widen the gap between the wealthy and the poor. Policies that target structural improvements (e.g. tax reform, regulation, physical infrastructure) are more likely to benefit lower income groups since the onus isn’t on the individual to take action and, at least in principle, all neighborhoods should be included.
To design policy to reduce health inequality, we need to know how it manifests in space, as well as the characteristics of the so-called ‘haves’ and ‘have-nots’. Thus it is critical to have a baseline of data that we can integrate with local knowledge. As members of this global knowledge partnership, we approach health inequalities from a number of disciplinary perspectives, and collate our knowledge to produce an empirical baseline to share with all stakeholders. With a deepened understanding of the health landscape, we can begin to identify policies that address emergent health issues in Pathways cities.