Written by Qizheng Wu (Tsinghua University)
Why is it essential to examine the quality of bicycling environment in Beijing?
According to statistics from the China Bicycle Association, more than 100 million people rely on bicycles as the primary transit mode in 2022. In the meantime, related news reports that the ownership of electric bicycles in China reached 350 million in the same year. The coexistence of such a high volume of electric and traditional bicycles on the road is bound to cause a significant risk to people’s riding safety. According to the statistics of the People’s Court of Chaoyang District, Beijing, from 2021 to 2022, the total processed cases of non-motor vehicles reached 535, with an increase of 51.17% in the number of cases received compared to last year. Given this fact, the Transport and Mobility team in the Pathways program sets out to assess the quality of the bicycling environment quality in the urban areas of Beijing.
How to obtain data that authentically reflects the bicycling environment quality?
Although there are various methods in existing literature for urban spatial data collection and auditing, they all have their own limitations. For example, due to the existence of street trees, it is difficult for satellite remote sensing method to capture the riding environments on the ground level comprehensively; Other commonly used street view imagery data, such as Google Street View and Baidu Street View, are both challenging to cover the bicycle lane environment because the data are recorded with cameras mounted on motor vehicles. To authentically reflect the riding environment on the bicycle lane, researchers need more targeted data captured from the bike lane perspective and with higher granularity.
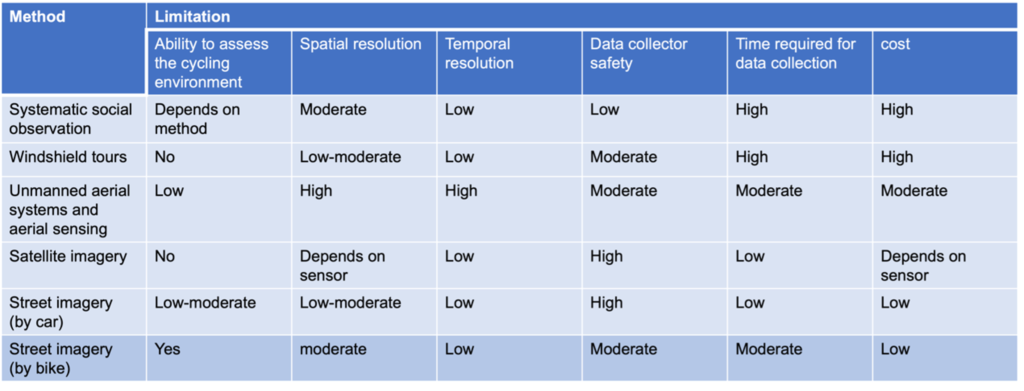
Fig 1. Urban space auditing techniques and their limitations.
Therefore, the researchers adopted the method of mounting sports cameras on electronic bicycles to acquire bike lane imagery data in Beijing. Although this method requires comparatively high time and labour costs, the quality and authenticity of data are guaranteed. This set of data also builds a solid foundation for future analysis. Most importantly, to our knowledge, this would become the first imagery data product of the non-motorized lanes covering the entire range of Beijing Fourth Ring Road.
To ensure the data collection process went smoothly, the research team established a 12-page workbook to standardize the data collection method. At the same time, all the road segments within the Beijing Fourth Ring Road area were distributed into 48 collection units to break down the workload into 48 collection days (Fig 3). The collection schedule is shown in Fig 2. The collection process lasted seven weeks and was completed by two researchers from the end of winter to the beginning of spring in 2023.
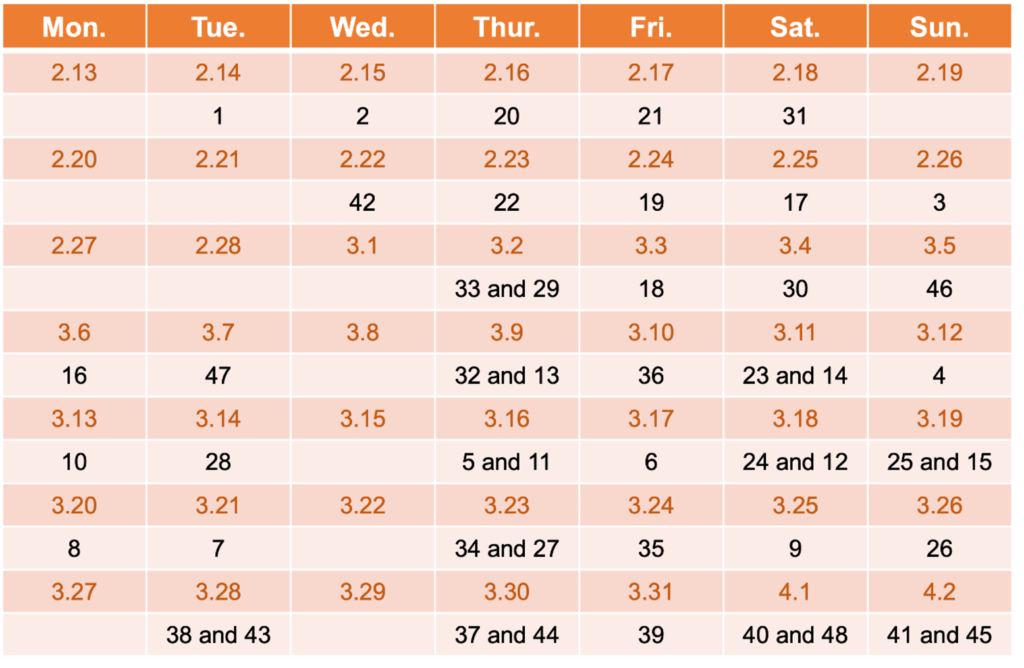
Fig 2. The data collection unit coding and corresponding collection date from February to April 2023.
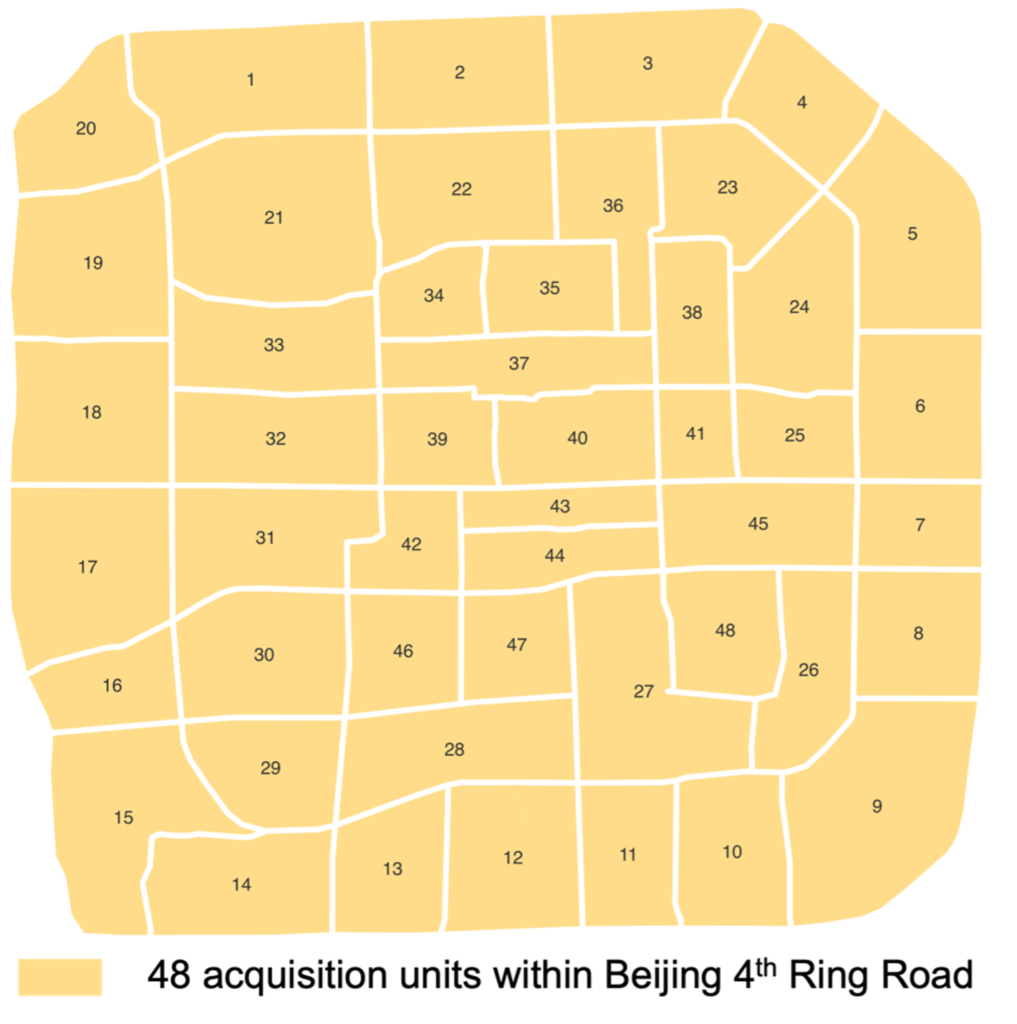
Fig 3. The data collection units and their geographic distribution within Beijing Fourth Ring Road areas.
What safety risks did we find during the data collection process?
The two researchers shared and concluded their findings and insights on the bicycling environment in Beijing after the 7-week data collection process. First, the entire study area covers multiple functional areas, and the biking experience largely diverges. For instance, the riding experience is relatively better around the embassy area owing to a smaller traffic volume, more comfortable overall road conditions, and higher quality of environment management. On the other hand, it was bizarre to cycle around several business districts. Over the past decade, there has been a boom in the food delivery industry in China, especially in megacities such as Beijing and Shanghai. We found that it was common for takeaway riders to park their vehicles around shopping malls, which is likely to cause road congestion and disturb traffic conditions. Second, the riding experience inside and outside the Second Ring Road in Beijing is also completely different. As many alleys lacked urban management in the traditional district within the Second Ring Road, the debris piled up by the citizens themselves made the already narrower space more difficult to pass through. It also brought many unexpected situations during the data collection process. Lastly, the research team listed six common cycling risk factors (Fig 4):
- Go in the wrong direction.
- Narrow bike lane
- On-street parking
- Bike lane blockage
- Adverse pavement condition
- Bike lane congestion
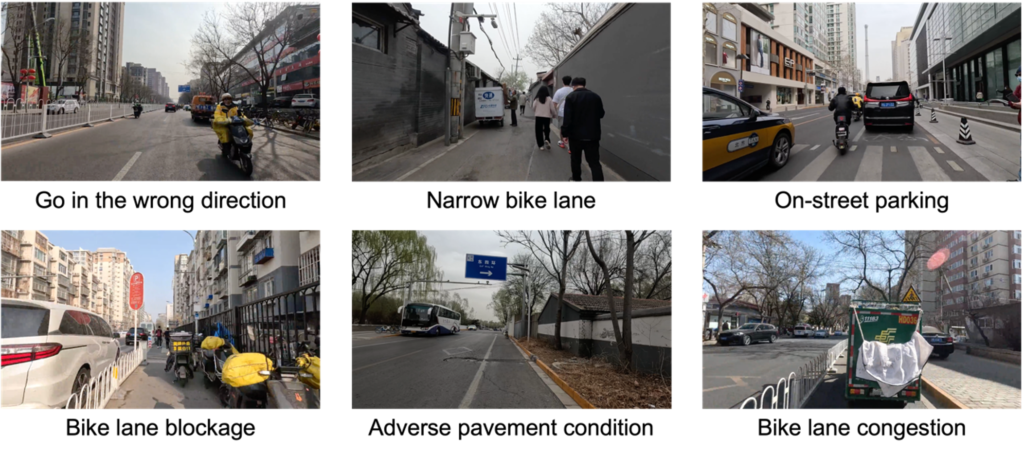
Fig 4. Typical risk factors were found during the data collection process.