Written by Dr. Yan Li
Beijing, the bustling capital city of China, is home to a diverse population with a wide range of socioeconomic backgrounds. In this blog post, we will delve into the socioeconomic status (SES) of Beijing’s neighborhoods, shedding light on the various factors that contribute to the city’s social and economic landscape. By examining key indicators and employing innovative techniques, we can gain a better understanding of the SES disparities that exist within the urban fabric of Beijing.
Measuring SES Using Multi-View Image Data:
Traditionally, obtaining accurate and comprehensive SES data at the neighborhood level has been a challenge, especially in emerging economies like China. However, recent advancements in technology have allowed us to overcome this hurdle. By harnessing publicly available full-coverage data, such as satellite and street view images, we can now estimate nSES with remarkable precision at a fine spatial resolution.
Our research team developed an ensemble regression framework that combines multi-view images to measure nSES inequality in Beijing. We trained our model using family and individual SES data obtained from a representative survey, enabling us to infer continuous values for eight indicators in five categories: hukou (China’s household registration system), housing, income, employment, and education.
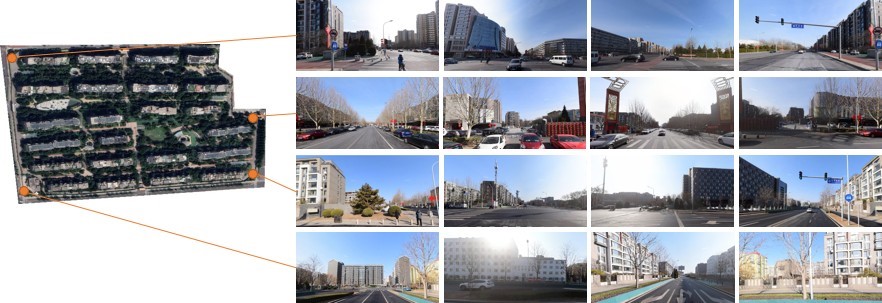
Figure 1. Satellite images of the 7,892 neighborhoods and street view images within the neighborhood as model inputs
Visualizing Neighborhood Inequalities:
One of the most significant contributions of our research is the visualization of neighborhood inequalities at both the traffic analysis zone (TAZ) and township scales within the urban area of Beijing. For the first time, we are able to map and visually represent the variations in nSES across the city. This information is invaluable for policymakers, urban planners, and community organizations to identify areas of focus and develop targeted interventions to address socioeconomic disparities.
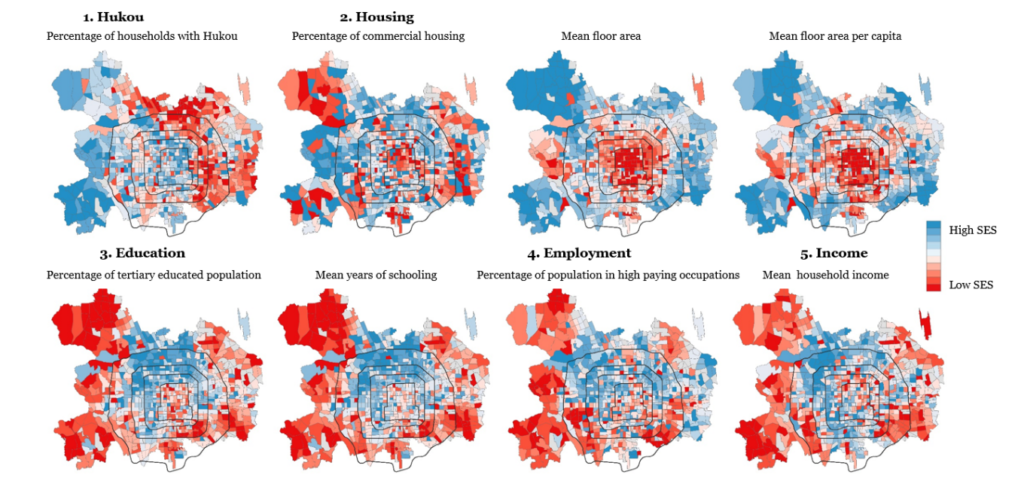
Figure 2. Neighborhood socioeconomic status mapping at traffic analysis zone level for central urban area of Beijing
Applying our proposed methodology, we plot the distribution of eight indicators for five dimensions of nSES in central urban area of Beijing, revealing distinct inequalities at different scales. The distribution map shows that the highest income areas in Beijing are in the northern part of the city with low-income areas predominantly in the east, northeast and southeast, and the western outskirts, although the eastern part of Beijing is being gentrified to contain small pockets of well-off areas. As in many other large cities, overcrowded housing conditions are a concern, especially in the old downtown, where space is limited and expensive, independent of income. The deprivation of the housing environment (a measure of the percentage of commercial housing, floor space and floor space per capita) is worse in the inner city, even in the more affluent areas, and improves towards the outskirts. At a finer scale, there is a complex distribution in terms of nSES indicators. The well-off and run-down neighborhoods are often adjacent to each other. The large differences in both nSES and related infrastructure conditions are known as folding Beijing, due to the state collapsing the dimensions of urban processes together and neighborhoods experiencing this in an infrastructurally disruptive way.